
Picture this: You see two coins trading at $10 each. One looks like a bargain because the price is low. The other feels expensive. But what if the $10 coin has billions of tokens in circulation, while the other has only a few thousand? Suddenly, that "cheap" coin is actually worth trillions, and the "expensive" one is tiny. This is why looking at price alone is a trap.
This is where Market Cap, or market capitalization, comes in. It is the single most important number for understanding the true size and value of any cryptocurrency. It strips away the illusion of token price and shows you the actual market value of the entire project. If you want to invest without getting burned by hype or misleading charts, you need to understand how market cap works, how it’s calculated, and what it tells you about risk and reward.
The Basic Formula: How Market Cap Works
Calculating market cap is surprisingly simple. It doesn’t require complex algorithms or insider knowledge. It uses a basic multiplication formula that anyone can check in seconds.
Market Cap = Circulating Supply × Current Price
Let’s break down the two variables:
- Circulating Supply: This is the number of coins or tokens currently available for public trading. It excludes coins that are locked, held by developers, or not yet mined. Think of it as the inventory on the shelves right now.
- Current Price: This is the real-time trading price of one single unit of that cryptocurrency.
For example, let’s look at Bitcoin. As of recent data, there are approximately 19.7 million Bitcoin coins in circulation. If each Bitcoin is trading at $65,000, the calculation is straightforward: 19.7 million multiplied by $65,000 equals roughly $1.28 trillion. That $1.28 trillion figure is Bitcoin’s market cap. It represents the total value investors have placed on all existing Bitcoin combined.
Why does this matter? Because price can be manipulated or misunderstood. A coin with a high price per unit might still be small in total value if its supply is low. Conversely, a coin with a penny price might be massive if its supply is in the billions. Market cap levels the playing field.
Circulating Supply vs. Total Supply: The Hidden Trap
One of the biggest mistakes new investors make is confusing different types of supply. Not all coins exist in the same way. Understanding the difference between circulating supply, total supply, and maximum supply is crucial for accurate valuation.
- Circulating Supply: Coins actively traded on exchanges. This is what we use for standard market cap calculations.
- Total Supply: All coins that currently exist, including those that are locked or held by the development team but haven’t been released yet.
- Maximum Supply: The hard limit of coins that will ever exist. For Bitcoin, this is 21 million. For Ethereum, there is no hard maximum cap, though issuance rates vary.
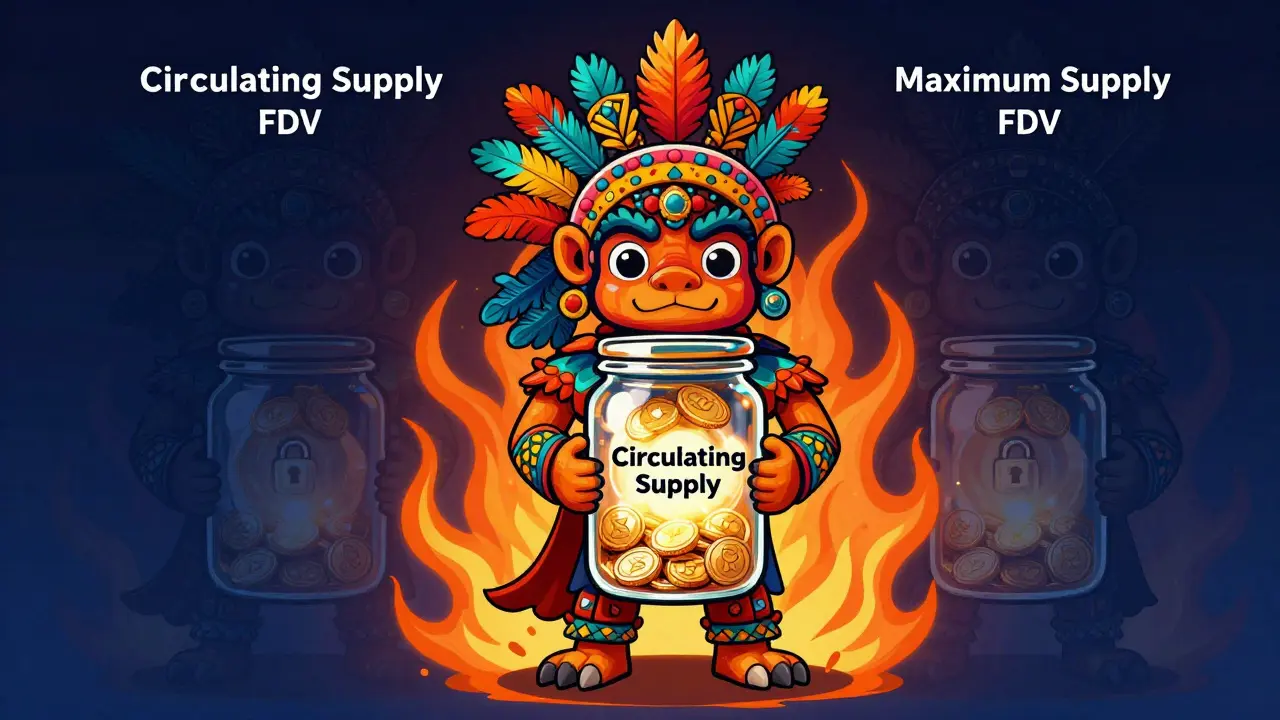
Here is where things get tricky. Many projects release coins gradually over time through vesting schedules for teams or investors. These future releases aren’t reflected in the current circulating supply. This leads us to another critical metric: Fully Diluted Valuation (FDV).
FDV calculates the market cap as if all possible tokens were already in circulation. The formula is: FDV = Maximum Supply × Current Price.
If a project has a low circulating supply but a huge maximum supply, its FDV will be much higher than its current market cap. This signals potential inflation risk. When those locked tokens eventually unlock and hit the market, they could sell pressure, driving the price down. Always check the FDV alongside the standard market cap to see the full picture.
Market Cap Tiers: Risk vs. Reward
In traditional finance, companies are categorized by their market capitalization to help investors gauge stability and growth potential. The crypto world uses similar tiers, though the thresholds are often lower due to the faster-moving nature of digital assets.
| Tier | Market Cap Range | Risk Level | Growth Potential | Typical Examples |
|---|---|---|---|---|
| Large-Cap | $10 Billion+ | Low to Moderate | Moderate | Bitcoin, Ethereum |
| Mid-Cap | $1 Billion - $10 Billion | Moderate | High | Solana, Cardano, Polkadot |
| Small-Cap | $100 Million - $1 Billion | High | Very High | New DeFi protocols, niche Layer 2s |
| Micro-Cap | Under $100 Million | Extreme | Lottery Ticket | Brand new meme coins, early-stage startups |
Large-Cap cryptocurrencies like Bitcoin and Ethereum are considered the "blue chips" of the industry. They have established networks, wide adoption, and significant liquidity. Moving their price requires billions of dollars in buying pressure, making them less susceptible to manipulation by a single wealthy investor, often called a "whale." They are generally safer bets for long-term holding, though their percentage gains may be slower compared to smaller coins.
Mid-Cap cryptocurrencies offer a sweet spot for many investors. These projects usually have working products and growing communities but haven’t reached mass adoption yet. They carry more volatility than large caps but offer substantial upside if the project succeeds. Solana is a prime example of a mid-to-large cap asset that has seen dramatic growth phases.
Small-Cap and Micro-Cap cryptocurrencies are the wild west. They are highly volatile, illiquid, and risky. A small amount of buying can send the price soaring, just as easily as selling can crash it. While you might find a gem here that returns 10x or 100x your investment, you are also far more likely to lose everything. These are not investments; they are speculative gambles.
Why Market Cap Matters More Than Price
Newcomers often fall into the "low price bias" trap. They think a coin priced at $0.01 is cheaper and therefore better than a coin priced at $1,000. This is mathematically incorrect. Price is irrelevant without context of supply.
Consider two hypothetical coins:
- Coin A: Price $100, Circulating Supply 1 million. Market Cap = $100 million.
- Coin B: Price $1, Circulating Supply 1 billion. Market Cap = $1 billion.
Even though Coin A has a higher price per unit, Coin B is ten times larger in total value. For Coin A to reach the same market cap as Coin B, its price would need to rise from $100 to $1,000-a 10x increase. For Coin B to double its market cap, its price only needs to go from $1 to $2.
Understanding this helps you set realistic expectations. It is much harder for a $1 trillion market cap coin to double in value than for a $100 million market cap coin to do the same. Large caps move slowly; small caps move fast. Knowing which category you are investing in dictates your strategy.
How Market Cap Changes: Supply and Demand Dynamics
Market cap isn’t static. It fluctuates constantly based on two main drivers: price changes and supply changes.
Price-driven changes are the most common. When more people buy a coin than sell it, the price goes up, increasing the market cap. When selling pressure dominates, the price drops, shrinking the market cap. This is driven by sentiment, news, technological upgrades, and macroeconomic factors.
Supply-driven changes are subtler but equally important. Some cryptocurrencies have inflationary models, meaning new coins are created regularly. For example, miners receive block rewards for securing the network. As these new coins enter circulation, the supply increases. If demand doesn’t keep pace, the price-and thus the market cap-can stagnate or drop even if the number of coins stays the same.
Conversely, some projects use deflationary mechanisms. Token Burns involve permanently removing coins from circulation. Ethereum, for instance, burns a portion of transaction fees during network activity. By reducing the circulating supply, scarcity increases, which can drive up the price and market cap if demand remains constant. Always check whether a project is inflationary or deflationary to understand long-term supply pressures.

Using Market Data Tools Effectively
You don’t need to calculate market cap manually every time. Several reliable platforms provide real-time data, historical charts, and comparative tools.
- CoinGecko: Known for its unbiased data and extensive categorization. It allows you to filter by sector (DeFi, Gaming, Meme) and view market cap rankings within those niches.
- CoinMarketCap: One of the oldest and most widely used trackers. It offers detailed charts showing market cap trends over days, weeks, months, and years. It also provides FDV data prominently.
When using these tools, pay attention to the "Market Cap Rank." This ranks cryptocurrencies by their total market value, not their price. Bitcoin is always #1, Ethereum #2, and so on. This ranking gives you an immediate sense of relative importance and liquidity in the ecosystem.
Also, watch out for anomalies. Sometimes, newly launched tokens have inflated market caps due to low liquidity or artificial trading volume. A high market cap with very low trading volume is a red flag-it means you might not be able to sell your holdings when you want to. Liquidity is king.
Common Pitfalls and Misconceptions
Even experienced investors can misinterpret market cap data. Here are three common traps to avoid:
- Ignoring Fully Diluted Valuation: As mentioned earlier, a low current market cap can be deceptive if millions of tokens are waiting to be unlocked. Always compare Market Cap to FDV. A large gap suggests future selling pressure.
- Assuming Stability Equals Safety: Just because a coin has a large market cap doesn’t mean it’s immune to crashes. In a bear market, even Bitcoin and Ethereum can drop significantly. Market cap indicates size, not immunity.
- Focusing Only on Top 100: While the top 100 coins by market cap are generally safer, innovation often happens outside this list. However, venturing beyond the top 100 requires deep research into tokenomics, team credibility, and utility. Don’t chase micro-caps just because they’re cheap.
Another misconception is that market cap directly correlates with technology quality. It doesn’t. A coin can have a huge market cap due to hype, speculation, or legacy status, even if its technology is outdated. Conversely, a revolutionary project might start with a tiny market cap. Use market cap as a measure of market confidence and liquidity, not necessarily technical superiority.
Conclusion: Making Smarter Decisions
Market cap is your compass in the chaotic world of cryptocurrency. It cuts through the noise of price fluctuations and reveals the true scale of a project. By understanding the formula, recognizing the differences between supply types, and respecting the risk profiles of different market cap tiers, you position yourself to make informed decisions.
Remember, investing in crypto is not about finding the cheapest coin. It’s about finding value. A large-cap coin offers stability and proven resilience. A mid-cap coin offers growth potential with manageable risk. Small and micro caps offer lottery tickets with high stakes. Know which game you are playing, check the FDV, verify the liquidity, and never invest more than you can afford to lose. With market cap as your guide, you navigate the digital asset landscape with clarity and confidence.
Is market cap the same as price?
No, they are completely different. Price is the cost of one single token. Market cap is the total value of all tokens in circulation. A coin can have a low price but a huge market cap if its supply is massive, or a high price but a small market cap if its supply is tiny.
What is a good market cap for a cryptocurrency?
There is no single "good" market cap. It depends on your risk tolerance. Large caps ($10B+) are safer and more stable. Mid caps ($1B-$10B) offer a balance of risk and reward. Small caps (under $1B) are high-risk, high-reward speculations. Diversifying across these tiers is a common strategy.
Why does market cap change so quickly?
Market cap changes because both price and supply can fluctuate. Price changes instantly based on buying and selling pressure on exchanges. Supply can change due to mining rewards, staking emissions, token unlocks, or burn events. Since market cap is Price × Supply, any shift in either variable affects the total value.
What is Fully Diluted Valuation (FDV)?
FDV is the theoretical market cap if all possible tokens were in circulation today. It is calculated by multiplying the maximum supply by the current price. FDV helps investors anticipate future inflation risks from token unlocks that aren't yet reflected in the current circulating supply.
Can a cryptocurrency have an infinite market cap?
Technically, yes, if the token has no maximum supply limit. Projects like Dogecoin or certain algorithmic stablecoins have unlimited supplies. In these cases, FDV cannot be calculated, and investors must rely solely on circulating supply and current price dynamics, paying close attention to inflation rates.
Does a high market cap mean a coin is safe?
Not necessarily. A high market cap indicates size, liquidity, and widespread adoption, which reduces the risk of manipulation. However, it does not guarantee price stability. Even large-cap coins like Bitcoin can experience significant percentage drops during market downturns. It is safer than micro-caps, but not risk-free.